
You open Pinterest Analytics and see a wall of numbers. Impressions. Saves. Outbound clicks. Engaged audience. Conversion rate.
It is a lot, and if you track the wrong ones, you can spend weeks creating content that looks productive but does nothing for your bottom line.
Most people gravitate toward the numbers that feel good. Follower count goes up? Great. Impressions hit a new high? Exciting. But neither tells you whether Pinterest is actually working for your business.
This guide cuts through the noise. It covers the metrics that matter, what each one tells you, and how to use them based on your specific goal: whether that is building awareness, driving traffic, or turning clicks into customers.
Table of Contents
Key Takeaways
- Pinterest is a visual search engine, not a social network; reach and intent signals matter far more than follower count.
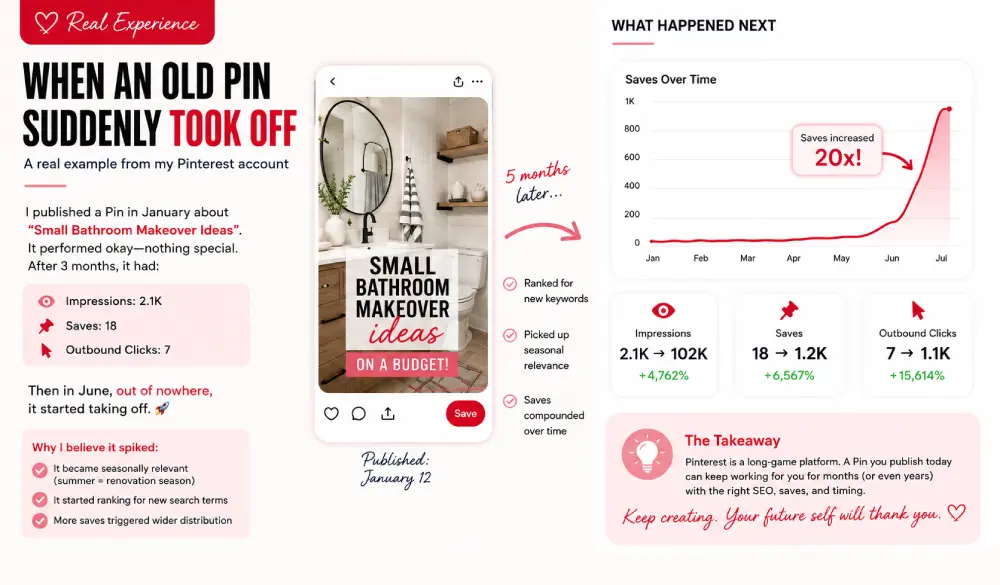
- Saves are the strongest organic signal on the platform. They trigger wider distribution and reflect real purchase intent.
- Outbound clicks are the most direct measure of whether Pinterest is sending traffic to your business.
- The right metrics to track depend entirely on your goal: awareness, traffic, or conversions.
- Conversion Insights only works once the Pinterest Tag or Conversions API is set up on your website.
- According to Pinterest’s Q4 2025 earnings release, the platform processed more than 80 billion searches per month, and half of those searches were commercial in nature, meaning users were actively looking to buy.
Quick Answer: What Are the Most Important Pinterest Analytics Metrics?
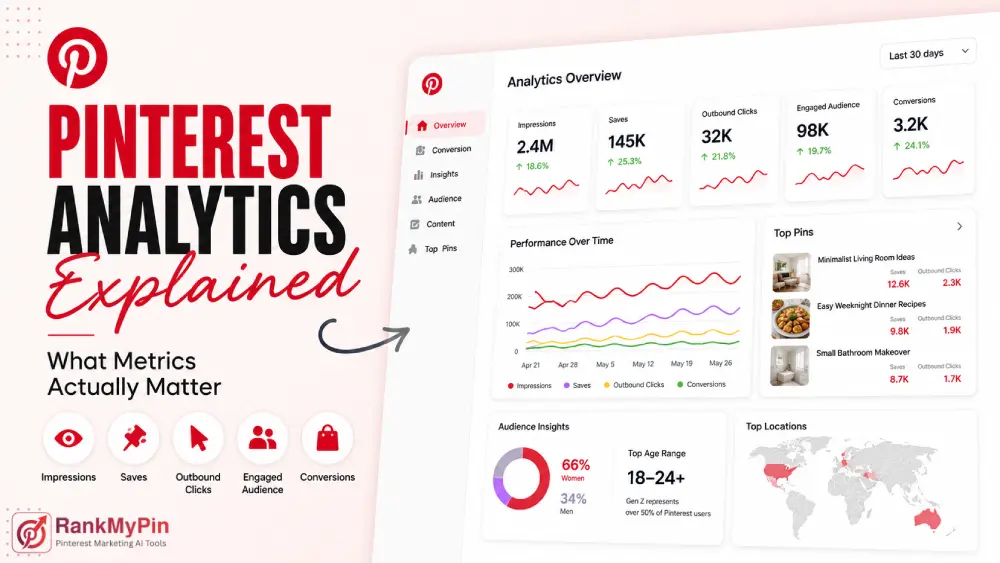
The metrics that matter most on Pinterest are saves, outbound clicks, impressions, engaged audience, and conversions. Saves show that users value your content enough to return to it. Outbound clicks show Pinterest is driving traffic to your site. Impressions measure distribution. Engaged audience shows how many unique people are taking action. Conversions track real business outcomes like purchases and sign-ups. Which ones to prioritize depends on your goal.
Why Pinterest Is Different, and Why That Changes Your Analytics
Pinterest is not a typical social platform. People go there to plan, research, and shop, not to passively scroll through a feed.
According to Pinterest’s Q4 2025 earnings release filed with the SEC, the platform processed more than 80 billion searches per month, with roughly half of those searches being commercial in nature. That is a scale you would expect from a search engine, not a social app.
That changes how you should read the data. On Instagram or TikTok, a like means a few seconds of attention. On Pinterest, a save means someone filed your content away to act on later: a recipe they plan to cook, a product they intend to buy, a room they are planning to redesign. The intent behind each interaction is fundamentally higher.
That higher intent is also why Pinterest analytics skews toward search-style metrics (impressions, saves, and clicks) rather than the follower-centric metrics you see on other platforms.
Where to Find Your Pinterest Analytics
Pinterest gives you three main places to review data. For a full walkthrough of each section, Pinterest’s official analytics guide is a useful starting point.
The Overview Dashboard is your starting point. Log in to your business account, click the menu at the top-left, and select “Analytics.” This shows impressions, engagements, total audience, and engaged audience across any time range.
Pin Stats goes deeper on individual Pins. Go to your profile, tap “Created,” click a Pin, and select “Pin stats.” You can see impressions, saves, pin clicks, and outbound clicks for each Pin. Video Pins also show watch time data.
Conversion Insights tracks how your Pins influence purchases and on-site actions. This section only activates once you have set up the Pinterest Tag or Conversions API on your website. Access it under “Analyze Performance” in the menu.
The Core Metrics, What They Mean and When They Matter
Impressions
Impressions count how many times your Pins appeared in someone’s feed, search results, or category page. Think of them as the top of your funnel: they show how much reach Pinterest is giving your content.
Impressions matter when you are building brand awareness. But in isolation, they can mislead you. A million impressions with zero saves or clicks is a signal that your content is being served but is not resonating. Watch impressions in relation to your other metrics, not alone.
Best for: Brand awareness goals, tracking distribution trends over time.
Saves: The Most Powerful Organic Signal
A save happens when a user adds your Pin to one of their boards. This is the single most valuable organic action on Pinterest, for two reasons.
First, saves feed the algorithm directly. The more saves a Pin gets, the more Pinterest shows it to similar audiences, no ad spend required.
Second, saves carry purchase intent. When someone saves your product to a board named “Wishlist” or “Home Goals,” they are signaling a future decision, not just passive appreciation.
According to Sprout Social’s 2026 Pinterest statistics report, users save over 1.5 billion Pins every week on the platform. That volume reflects how central saving is to how people use Pinterest.
Save Rate Formula: Total Saves ÷ Total Impressions × 100
Best for: Every goal. Saves drive organic reach, long-term traffic, and shopping intent signals.
Outbound Clicks: The Most Underrated Traffic Metric
Outbound clicks measure how many times someone tapped the link on your Pin and landed on your website. This is the number that ties Pinterest directly to business results: traffic, leads, and sales.
It is easy to confuse pin clicks with outbound clicks. A pin click means someone tapped the Pin to see it larger, still inside Pinterest. An outbound click means they left Pinterest entirely and arrived on your site.
If your goal is traffic or revenue, outbound clicks are the number you should watch most closely.
Here is what the data can tell you:
- High impressions + low outbound clicks: Your visual is visible but not compelling, or your call to action is missing.
- High pin clicks + low outbound clicks: Your image stopped the scroll, but the description is not converting that curiosity into a visit.
- Strong outbound clicks: Pinterest is actively sending traffic to your business.
Best for: Website traffic goals, eCommerce, lead generation.
Total Audience vs. Engaged Audience
These two are easy to mix up, and they tell you very different things.
Total audience is the number of unique people who saw or engaged with your Pins in a given period, including anyone who just had a Pin appear in their feed without doing anything.
Engaged audience is the smaller group who actively interacted: a save, a pin click, or an outbound click.
Tracking both together gives you a real engagement ratio. If your total audience is 40,000 and your engaged audience is 1,600, about 4% of the people who encountered your content took action.
Watch how that percentage trends month over month. Steady growth in engaged audience relative to total audience means your content quality is improving.
Engagement Rate
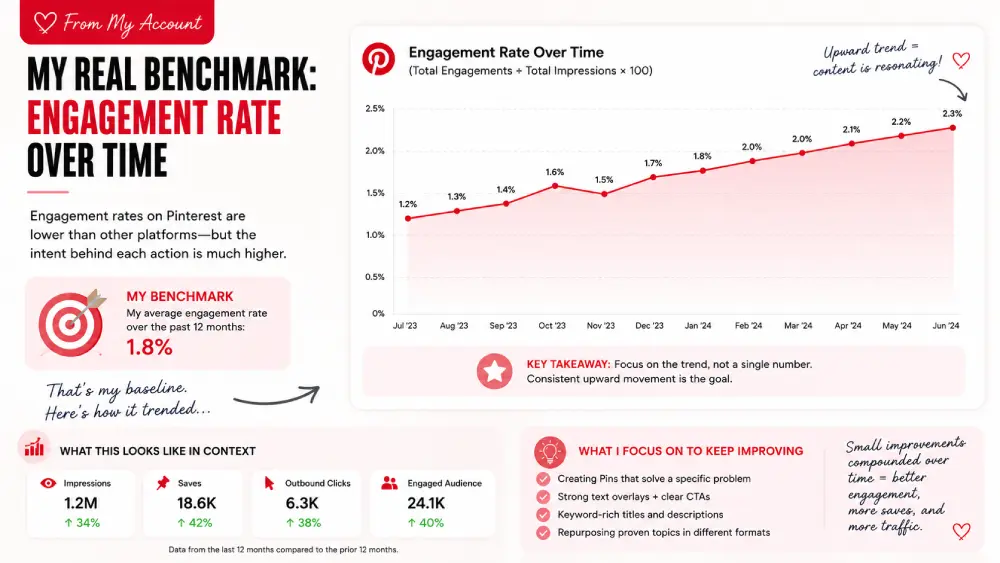
Engagement rate is your total engagements divided by total impressions, multiplied by 100.
Formula: (Total Engagements ÷ Total Impressions) × 100
Engagements on Pinterest include saves, pin clicks, and outbound clicks. The rate is typically lower than what you see on Instagram or TikTok, but that is not a weakness.
A save on Pinterest carries far more purchase intent than a like on a social feed. The quality of each interaction is higher.
Focus on the trend, not a single number. If your engagement rate is steadily rising month over month, you are moving in the right direction.
Goal-Based Metrics: What to Track Based on What You Want
Pinterest maps its analytics directly to business goals, which is one of the most practical things about the platform.
The Pinterest beginner content guide also recommends focusing on saves, comments, and follows as the primary signals that your content is inspiring real action.
Building Brand Awareness
Track: Impressions, Total Audience, Engaged Audience, Saves
Focus on how broadly your Pins are being seen and saved. A growing total audience month over month signals that your reach is expanding. Saves accelerate this by triggering more algorithm-driven distribution.
Driving Website Traffic
Track: Outbound Clicks, Save Rate, Total Audience
Outbound clicks show exactly how much traffic Pinterest is sending your way. Cross-reference with Google Analytics or your website platform to confirm actual landing page visits and measure quality.
Generating Conversions or Sales
Track: Conversions, Outbound Clicks, Total Audience, Engaged Audience
Conversions only appear in Pinterest Analytics after you set up the Pinterest Tag or Conversions API. Once live, you can see add-to-cart actions, checkouts, sign-ups, and purchases that your Pins directly influenced.
Pinterest’s official Conversions API documentation recommends running both the Tag and the API together, noting that the dual setup maximizes conversion visibility and leads to better campaign outcomes.
Metrics That Look Important but Often Are Not
Follower Count
Follower count matters less on Pinterest than on almost any other platform. Pinterest distributes content through search and algorithmic feeds, not through a follower subscription model. A brand with zero followers can publish a strong Pin today and reach thousands of new people within days if the content performs well.
Track follower count as a loose trust indicator. Do not optimize for it.
Close-Ups
A close-up happens when someone taps your Pin to see more detail but does not click through to your website. It can signal visual interest, but it is a weak signal. If close-ups are high but outbound clicks are flat, your image is catching attention, but your call to action is not completing the job.
Pinterest Audience Insights
The Audience Insights section shows you who is actually engaging with your content: age ranges, genders, locations, and interest categories. Check it monthly, especially when your content strategy shifts.
For context on the broader user base: Pinterest’s 2025 Annual Report filed with the SEC states that women make up roughly two-thirds of the total user base, and Gen Z represents over 50% of all users.
Pinterest CEO Bill Ready confirmed the Gen Z milestone directly in the company’s Q2 2025 earnings release, saying: “Gen Z has grown to over half of our user base.”
These figures are useful when comparing your engaged audience against the platform average. If your audience skews significantly different from these baselines, it tells you something meaningful about who your content is reaching.
How to Find Your Best-Performing Pins
One of the most useful habits in Pinterest Analytics is sorting your Pins by specific metrics. Pinterest’s own content guidance recommends regularly reviewing what is performing well and using that data to plan future content.
From your Overview dashboard:
- Click “Top Pins” in the left navigation.
- Use the dropdown to sort by saves, outbound clicks, impressions, or engagements.
- Look for patterns: image style, keywords used, topic, format, call to action.
Sort by saves to find your strongest long-term content. Sort by outbound clicks to find what is driving actual traffic. Do this at least once a month, and use what you find to shape your next batch of Pins.
How Often Should You Check Pinterest Analytics?
Weekly (10 minutes): Scan the Overview for impressions, engaged audience, saves, and outbound clicks. Flag any unusual spikes or drops.
Monthly (30–45 minutes): Sort Top Pins by saves and outbound clicks. Review Audience Insights. Compare month over month.
Quarterly: Set benchmarks. Track whether your save rate, outbound click rate, and engaged audience are trending upward. Adjust your strategy accordingly.
FAQ: Pinterest Analytics
What is the difference between pin clicks and outbound clicks?
Pin clicks stay within Pinterest; someone taps your Pin to see it in more detail. Outbound clicks leave Pinterest; the user taps your link and lands on your website. For business results, outbound clicks are the ones to watch.
Do followers matter on Pinterest?
Less than on most platforms. Pinterest distributes content through search and algorithmic feeds, not follower subscriptions. Strong saves and good keyword use will reach new audiences regardless of your follower count.
How do I see conversion data in Pinterest Analytics?
Set up the Pinterest Tag or Conversions API on your website first. Once tracking is live, go to “Analyze Performance” in your Pinterest menu and select “Conversion Insights.” You will see purchases, add-to-cart actions, sign-ups, and other on-site events driven by your Pins.
Why are my impressions deep but outbound clicks low?
Three common causes: your visual is not compelling enough to prompt action; your description is missing a clear call to action; or your content is inspirational but does not give the viewer a clear next step. Test adding a direct CTA in your Pin title and description.
What is a good engagement rate on Pinterest?
It varies widely by niche, account size, and content type. Rather than chasing a universal benchmark, track your own rate over time. Consistent upward movement is the goal.
What is the best way to use Audience Insights?
Use it to confirm that the people engaging with your Pins actually match your target customer. If you notice strong engagement from an unexpected group, that is a signal worth acting on, either by creating more content for that segment or by adjusting your keywords to attract your intended audience.
Conclusion
Pinterest Analytics rewards focus. Saves tell you whether your content resonates. Outbound clicks tell you whether Pinterest is sending real traffic. Conversions tell you whether that traffic is turning into revenue.
Stop treating impressions and follower counts as the headline metrics. Use your dashboard as a weekly feedback loop, one that tells you what to make more of, what to fix, and where to focus your energy.
The platform is built for discovery and purchase intent. Your analytics show whether your content is part of that process.